
March 30, 2026

Summary
As developed in Part II of “The false comfort of EBITDA”, the case of Tecnoflex illustrates the dangerous disconnect between accounting profitability and actual liquidity within an expanding company. Despite achieving record growth in sales and a positive EBITDA, the company faces insolvency due to an inefficient cash cycle and high capital expenditures.
The text details how prolonged customer payment terms, combined with investments in machinery, consumed cash flow faster than the business could generate it. This situation demonstrates that operational success is of little value if it does not translate into immediate financial availability to meet obligations. Ultimately, the source concludes that a company does not collapse for lack of profit, but rather due to the depletion of its cash reserves.
Introduction: From €5M to €12M
In January 2022, Tecnoflex celebrated surpassing €5 million in revenue with an EBITDA margin of 12%. However, commercial expansion in the following years drove demand sharply upward, reaching a record €12 million in revenue by December 2024.
Despite this operational success, the company now faces technical insolvency, with negative cash balances and an inability to meet essential payment obligations
Business Model and Financial Structure
Tecnoflex’s crisis does not stem from a lack of demand, but from a structural imbalance in its cash flow dynamics:
• Customer payment terms (OEM clients): 90–120 days
• Supplier payment terms: 30–40 days
• Capital intensity: production requiring specialized machinery and increasing inventory levels to secure supply
Detailed Financial Information (Years 1 to 4)
1. Income Statement and Cash Flow
The comparison clearly shows how accounting profitability (EBITDA) is systematically absorbed by working capital requirements and investment needs (CapEx).
Table 4.1: Profitability vs Liquidity Disconnect (€ thousands)
| Concept | Year 1 | Year 2 | Year 3 | Year 4 |
| Revenue | 5,000 | 7,000 | 9,500 | 12,000 |
| EBITDA | 600 | 910 | 1,280 | 1,620 |
| Change in Working Capital | -450 | -820 | -1,050 | -900 |
| CapEx | -250 | -500 | -700 | -600 |
| Interest and Debt Service | -100 | -210 | -390 | -610 |
| Net Cash Flow | -200 | -620 | -860 | -490 |
Figure 1. EBITDA vs Cash Flow — A Growing Divergence
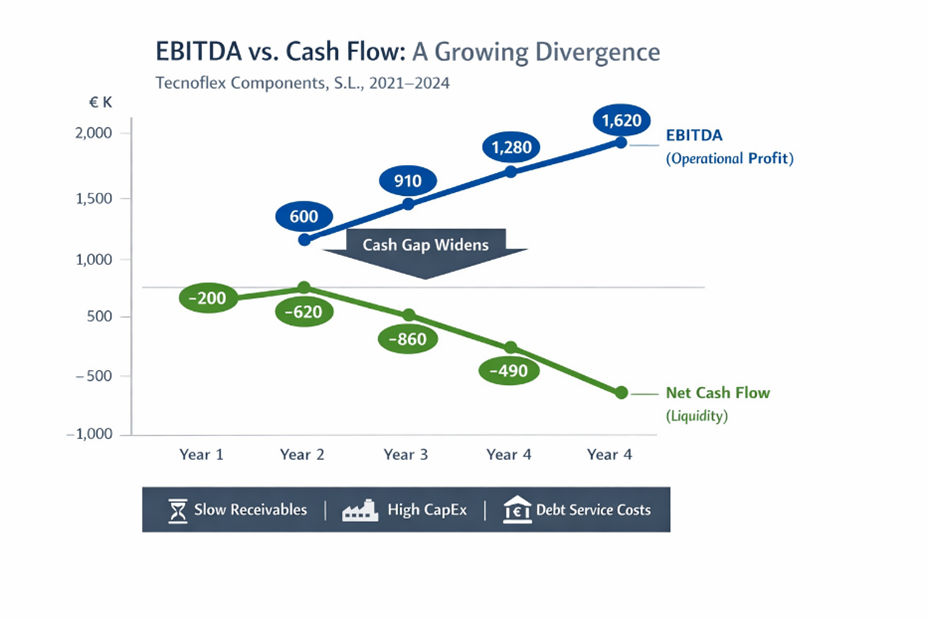
Graph interpretation:
- EBITDA shows a consistent upward trend → apparent operational strength
- Cash flow deteriorates over time → structural financial weakness
- The gap between both widens year after year → systemic, not temporary issue
This pattern is characteristic of companies that fail despite growth: they do not fail in the market — they fail in liquidity.
2. Working Capital and Liquidity Management
The cash conversion cycle deteriorates while the company progressively exhausts its borrowing capacity.
Table 4.2: Cash Position and Cash Cycle Evolution
| Indicator / Concept | Year 1 | Year 2 | Year 3 | Year 4 |
| Cash Conversion Cycle (days) | 102 | 114 | 119 | 126 |
| New Debt Raised | 0 | 700 | 800 | 300 |
| Closing Cash (€ thousands) | 100 | 180 | 120 | -70 |
Critical Moment Analysis
In the final quarter of Year 4, the paradox of profitability reaches its peak.
Table 5: Liquidity Crisis Snapshot
| Operational Success Factors | Financial Stress Factors |
| Strong order book and active customer demand | Record sales still uncollected (DSO: 105 days) |
| Highest EBITDA in company history (€1.6M) | Suppliers demanding immediate payment |
| Accelerated revenue growth | Banks restricting additional credit lines |
| Positive operating result | Inability to meet payroll and debt obligations |
Strategic Ratios and Diagnosis
To fully understand the severity, we analyze the Cash Conversion Ratio — how much of EBITDA actually translates into cash.
Table 6: Cash Conversion Efficiency Analysis
| Metric / Year | Year 1 | Year 2 | Year 3 | Year 4 |
| Cash Conversion Ratio (Net Cash / EBITDA) | -33% | -68% | -67% | -30% |
| Implication | Cash destruction from the outset | Growth accelerates resource consumption | Full dependence on external financing | Funding model exhausted |
Diagnosis and Final Conclusions: The Three Drivers of the Crisis
The analysis identifies why €12 million in revenue led the company to the edge of collapse:
1. Working Capital Pressure
Growth forced the company to effectively finance its customers due to the widening gap between receivables (105 days) and payables (34 days)
2. Structural CapEx
Investments required to sustain growth are not captured by EBITDA, yet they generate significant cash outflows
3. Debt Burden
Debt used to sustain growth ultimately reduces financial flexibility through rising interest and repayment obligations
Final Reflection
Tecnoflex demonstrates that liquidity is fundamentally a timing issue, not just a margin issue.
A company does not fail because it is unprofitable — it fails because it runs out of cash.
P.S/ I would like to thank both L.N. and A.F. for proposing the idea of developing these two articles, which aim to illustrate the challenges of P&L management and how they only partially translate into actual cash flow dynamics.